Introduction
Most businesses deploy chatbots to cut costs and improve service. Few actually know if it's working.
According to Tidio, only 44% of companies use message analytics to monitor chatbot effectiveness. That means more than half of teams deploying AI-powered customer service have no clear picture of whether their chatbot is resolving issues or frustrating thousands of users.
The stakes are higher in 2026. The shift from rule-based scripts to LLM-powered assistants and agentic AI systems means a single misconfigured response can damage trust at scale. Gartner predicts that by 2028, at least 70% of customers will begin their service journey using a conversational AI interface, making measurement foundational, not optional.
This guide breaks chatbot KPIs into three tiers: Efficiency, Customer Experience, and Business Impact. It also covers the emerging 2026 metrics that LLM and agentic AI systems specifically require.
Key Takeaways
- Chatbot KPIs fall into three tiers: Efficiency, Customer Experience, and Business Impact — track at least one from each
- Automation rate, resolution rate, and fallback rate are the first three metrics to configure from day one
- LLM-specific metrics like hallucination rate and token cost efficiency are now operational requirements, not optional extras
- SMBs: start with 5–6 core KPIs and expand as the chatbot matures
- The right monitoring stack prioritizes metrics tied to actual business outcomes over expensive tooling
Why Chatbot KPIs Require a New Standard in 2026
Traditional customer service metrics were built for human agents. Average handle time, tickets per agent, hold time — these assume a person on the other end with a finite capacity. Chatbots don't work that way.
A single misconfigured response in a rule-based bot affects one conversation. The same error in an LLM-powered assistant can frustrate thousands of users simultaneously before anyone notices. The Air Canada chatbot case — where the company was ordered to pay CA$812 in damages after its chatbot gave a passenger incorrect policy information — illustrates what happens when AI outputs go unmonitored.
The 2026 Shift: From Scripts to Agents
The fundamental change isn't just that chatbots are smarter. It's that they now act — booking appointments, updating records, processing multi-step requests without human oversight. Gartner predicts agentic AI will autonomously resolve 80% of common customer service issues without human intervention by 2029, with a projected 30% reduction in operational costs.
The risk: legacy KPIs weren't built to catch multi-step failure modes, hallucinated responses, or token-level cost spirals that come with that scale.
Two Dimensions Every Framework Must Cover
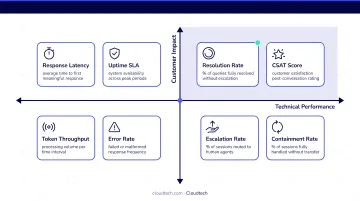
Every chatbot KPI framework should measure across two axes:
- Technical performance — speed, accuracy, uptime, fallback rates, and (for LLMs) token efficiency
- Customer impact — satisfaction, effort, loyalty signals, and return usage
A chatbot that scores well on only one dimension is optimizing the wrong thing. Speed means nothing if the answers are wrong — and wrong answers at scale are expensive to walk back.
Tier 1 — Efficiency KPIs: Is Your Chatbot Actually Working?
These are the operational metrics that tell you whether your chatbot is doing its job at a basic level.
Automation Rate
Formula: Fully bot-resolved inquiries ÷ Total inquiries × 100
This is the headline efficiency metric — the percentage of incoming inquiries fully handled without human intervention. Well-optimized AI chatbots typically achieve 70–85% automation rates; anything below 50% signals knowledge base gaps or insufficient training coverage.
The primary driver of automation rate is knowledge base quality. A chatbot that can't find answers it should know will always underperform.
Resolution Rate (First Contact Resolution)
Formula: Inquiries resolved on first contact ÷ All incoming inquiries × 100
Resolution rate is not the same as automation rate. Automation rate measures whether the bot responded. Resolution rate measures whether it actually solved the problem.
The gap between the two numbers reveals what's called deflection without resolution — the chatbot answered, the user didn't escalate, but the problem wasn't fixed. That gap erodes trust quietly — customers who don't complain rarely come back.
Escalation Rate
Formula: Conversations handed off to human agents ÷ Total chatbot conversations × 100
Benchmark: Below 25% for optimized deployments
Some escalation is healthy — complex or sensitive issues belong with humans. But sudden spikes in escalation rate indicate knowledge base gaps. When escalation climbs, the right move is to segment by topic, identify which intent categories are driving transfers, and prioritize those for retraining.
Fallback Rate
Formula: Unrecognized queries ÷ Total queries × 100
Benchmarks: Below 10% is acceptable; below 5% is excellent; above 20% indicates serious NLP or training issues
Fallback rate measures how often the chatbot couldn't understand the query and returned a generic error. One practical approach: export fallback logs weekly and identify the top 10 unrecognized topics. Addressing those consistently is one of the fastest ways to cut fallback rate.
Average Handling Time (AHT)
Benchmark: 2–5 minutes for standard customer service inquiries
For chatbots, shorter is not automatically better. Very short conversations often indicate abandoned interactions, not fast resolutions. The healthy pattern looks like this:
- Simple queries (order status, FAQs): short AHT is expected and healthy
- Complex issues: longer AHT signals genuine problem-solving, not inefficiency
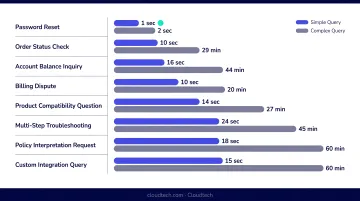
Segment by inquiry type before drawing conclusions.
Tier 2 — Customer Experience KPIs: Are Customers Actually Satisfied?
Efficiency metrics tell you what the bot is doing. Experience metrics tell you what customers think of it.
Customer Satisfaction Score (CSAT)
Formula: Positive ratings ÷ Total ratings × 100
Benchmark: Above 80% positive ratings; cross-industry average sits around 4.1 out of 5
CSAT is typically collected via a post-interaction survey — a simple 1–5 scale or thumbs up/down. The most useful analytical move: track CSAT separately for bot-handled versus human-handled conversations. That comparison directly reveals whether the chatbot is enhancing or undermining the overall customer experience.
Customer Effort Score (CES)
Deployment: A single post-interaction question — "How easy was it to resolve your issue today?"
Target: Below 2.5 on a 5-point scale for digital self-service
CES measures how much work the customer had to do to get an answer. Research from HBR studying more than 75,000 customers found that 94% of low-effort customers intended to repurchase, compared to just 4% of high-effort customers. For chatbots specifically, CES is the strongest diagnostic for conversation flow quality — high effort scores point directly to confusing dialogue, too many steps, or unclear options.
Drop-off / Abandonment Rate
Formula: Sessions abandoned before resolution ÷ Total sessions × 100
Drop-off is not the same as deflection. Deflection (a user self-serving without needing a human) is a positive outcome. Drop-off (a user exiting without any resolution) is a red flag.
Step-level drop-off data is where the real insight lives. When you can see which step causes users to leave, you can pinpoint exactly where patience breaks down — and fix it. Common culprits include:
- Ambiguous menu options that don't match how users phrase their problems
- Too many confirmation steps before reaching a useful response
- Dead-end responses that offer no next action or escalation path
Return Visitor Rate
Benchmark: Above 30% indicates the chatbot is perceived as reliable
Return visitor rate — the share of users who voluntarily come back to the chatbot — is an underrated trust signal. No customer willingly returns to a tool that failed them.
Tracking return rate alongside conversation depth (number of topics raised per session) gives a fuller picture of genuine chatbot utility versus one-and-done usage.
Tier 3 — Business Impact KPIs: What Is the Chatbot Worth?
These metrics connect chatbot performance directly to financial outcomes.
Ticket Deflection Rate
Formula: Inquiries resolved without a ticket ÷ Inquiries that would otherwise have created a ticket × 100
Benchmark: Leading systems deflect 50–80% of potential support tickets
Every deflected ticket saves 5–15 minutes of agent time, and at scale that savings compounds fast. Unlike resolution rate (which looks at all chatbot conversations), deflection rate focuses specifically on load reduction for the support team. That focus makes it the most directly ROI-translatable efficiency metric in your toolkit.
Conversion Rate
Formula: Conversations resulting in a target action ÷ Total chatbot conversations × 100
Benchmark: 5–15% for chatbots with clear, well-designed conversation flows
For e-commerce and SaaS companies, conversion rate can mean a lead captured, a demo booked, or a purchase completed. Multiply that rate by average deal or order value and you convert a percentage into a revenue figure — the number that actually moves budget conversations.
ROI Calculation Framework
A practical formula for SMBs:
ROI = (Deflected ticket volume × Cost per ticket) + Revenue uplift from conversions − Chatbot operating costs
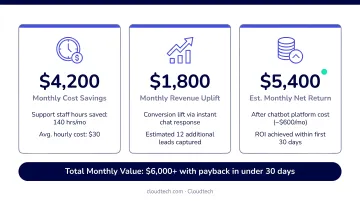
Example: An SMB handling 1,500 support inquiries per month achieves a 60% deflection rate. Here's how the numbers break down:
- 900 tickets deflected at 10 minutes of agent time each, fully loaded at $25/hour = $3,750 in monthly savings
- 8% conversion rate across 500 product inquiry conversations at a $50 average order value = $2,000 in monthly revenue uplift
- Minus $500 in monthly platform costs
Net monthly ROI: $5,250 — from a modest, mid-range deployment.
Emerging 2026 Metrics: LLM and Agentic AI KPIs
These metrics didn't exist when most chatbot measurement frameworks were written. They're not optional anymore.
Hallucination Rate
LLM-powered chatbots can generate confident, fluent, completely false answers. Unlike traditional bot errors (which are obvious), hallucinations look correct. That's what makes them dangerous. The NIST AI Risk Management Framework formally categorizes these as "confabulations" that can occur across generative AI outputs.
Tracking method: sample a percentage of conversations weekly and check responses against verified knowledge base content. Some teams use automated fact-checking against structured data sources.
There's no universally agreed threshold yet. Any confirmed hallucination in a customer-facing deployment warrants immediate review.
Token Cost Efficiency
LLM-based chatbots are billed on token usage — every word in and out costs money (this is the one em-dash worth keeping here). This creates a new operational KPI that simply didn't exist with rule-based bots.
Key sub-metrics to track:
- Average tokens per conversation
- Cost per successfully resolved inquiry
- Context window utilization — are you sending more context than needed?
Optimizing prompt structure and conversation design can meaningfully cut token spend without degrading answer quality. With input costs ranging from $0.08 to $5+ per million tokens depending on the model and provider, this matters at volume.
Agentic Task Completion Rate
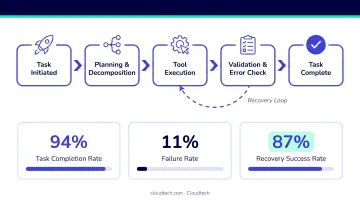
Formula: Multi-step tasks completed without errors ÷ Total multi-step tasks × 100
Target: Above 85% journey completion for digital self-service
When a chatbot books an appointment, updates a record, or processes a request across multiple systems, a failure at step three of five is invisible to traditional metrics. Agentic task completion rate captures the full success or failure of a workflow, not just whether the bot responded.
Track recovery rate alongside it: how often does the system recover from a mid-task error without abandoning the interaction entirely? A high completion rate with a low recovery rate signals brittle automation that fails silently.
AI Accuracy Rate vs. False Positive Rate
These are distinct metrics that require separate tracking:
- Accuracy rate: Percentage of responses that are correct and contextually appropriate
- False positive rate: How often the chatbot answers confidently but incorrectly
False positives are harder to catch than obvious errors and more damaging to trust, because customers act on them. Regular accuracy audits: sampling conversations against known-correct answers is the primary measurement method. Sampling has to be a consistent operational practice, not a quarterly checkbox.
How to Build Your Chatbot KPI Monitoring Stack
Core Dashboard Elements
An effective KPI dashboard needs four layers:
- Real-time view — current volume, active sessions, response time, live fallback alerts
- Trend analysis — weekly CSAT, deflection rate, and containment rate over time
- Anomaly detection — automated alerts when escalation rate spikes or satisfaction drops
- Conversation drill-down — the ability to review individual sessions when a metric flags an issue
The goal is actionability. Total interactions and messages exchanged are vanity metrics. What matters is whether the chatbot is resolving issues, containing costs, and satisfying customers.
AWS-Native Tooling for SMBs
For businesses running AI workloads on AWS, the native monitoring stack removes the need for custom infrastructure. Three tools do most of the heavy lifting:
- Amazon Lex — built-in analytics covering intent success/failure rates, dropped conversations, and missed utterances
- Amazon CloudWatch — real-time telemetry, logging, and alerting across the chatbot infrastructure
- AWS Lambda monitoring — tracks invocations, errors, and duration for any backend functions the chatbot depends on
Cloudtech's AWS-certified team helps SMBs configure this monitoring architecture quickly, connecting these tools into a single KPI dashboard that reflects actual business outcomes rather than raw system telemetry.
Review Cadence
| Frequency | Focus |
|---|---|
| Daily | Anomaly checks — volume spikes, escalation rate jumps, fallback alerts |
| Weekly | CSAT trends, deflection rate, fallback rate review |
| Monthly | ROI calculation, knowledge base gap analysis, ticket deflection deep dive |
| Quarterly | KPI recalibration — align metrics with evolving business goals |
The cadence matters as much as the metrics.
Frequently Asked Questions
What are key performance indicators (KPIs) for AI models?
KPIs for AI models span both technical metrics — accuracy rate, latency, hallucination rate, token efficiency — and outcome metrics like resolution rate, task completion rate, and CSAT. The right mix depends on whether the model is customer-facing, agentic, or embedded in internal workflows.
What advancement in customer service bots is expected for 2026?
The shift is from reactive FAQ-style bots to proactive agentic AI that takes multi-step actions — combined with LLM-powered natural language understanding, real-time sentiment detection, and tighter CRM integration. Today's chatbots routinely handle complex, context-rich interactions without human handoff.
What is a good chatbot automation rate benchmark for 2026?
Well-optimized AI chatbots typically achieve automation rates in the 70–85% range. Rates below 50% suggest knowledge base or training gaps; rates above 85% paired with strong CSAT indicate a mature, high-performing deployment.
What is the difference between deflection rate and resolution rate?
Deflection rate measures how many inquiries didn't require human intervention — the chatbot responded. Resolution rate measures how many were actually solved to the customer's satisfaction. A high deflection rate with a low resolution rate means the chatbot is deflecting without solving the problem.
How do you calculate chatbot ROI for a small business?
Use this formula: (deflected tickets × cost per ticket) + revenue uplift from conversions − chatbot operating costs. Even a 50–60% deflection rate at typical SMB ticket volumes often generates monthly savings that exceed the platform's operating cost within the first quarter.